What Is a Profit and Loss Statement? A Complete Beginner’s Guide
Running a business can feel confusing when sales are increasing but the money left at the end of the month doesn’t seem to match your expectations. Many business owners look only at revenue and miss the bigger picture: where money is coming from, where it is being spent, and whether the business is actually becoming more profitable.
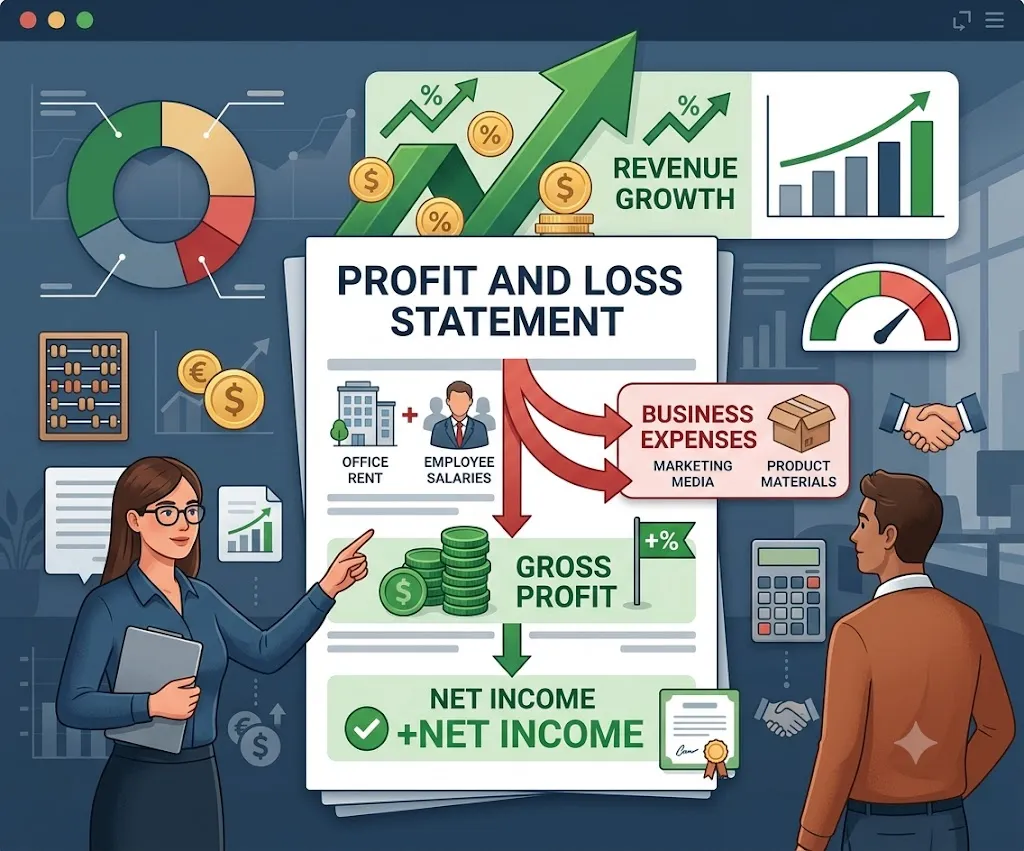
A profit and loss statement helps answer these questions by turning financial activity into a clear picture of business performance.
After reviewing financial reports for businesses of different sizes, one thing becomes clear: companies that regularly understand their numbers usually make better decisions. They identify unnecessary costs faster, plan growth more effectively, and avoid surprises.
In this beginner’s guide, you’ll learn what a profit and loss statement is, how each section works, and how businesses use it to measure profitability and make smarter financial decisions.
Most businesses prepare profit and loss statements using accrual accounting, where revenue and expenses are recorded when they are earned or incurred rather than only when cash is received or paid. This approach provides a more accurate view of business performance during a specific accounting period.
Companies may prepare financial statements according to accounting frameworks such as Generally Accepted Accounting Principles (GAAP) in the United States or International Financial Reporting Standards (IFRS) in many countries worldwide. These standards help ensure financial reports are prepared consistently and can be compared more easily
Profit and Loss Statement at a Glance
If you’re new to business finances, this quick overview explains the basic purpose of a profit and loss statement.
| Feature | Description |
| Also Called | Income Statement, P&L Statement |
| Main Purpose | Shows business profit or loss during a specific period |
| Basic Formula | Revenue – Expenses = Net Profit or Net Loss |
| Reporting Period | Monthly, Quarterly, or Annually |
| Used By | Business owners, managers, investors, lenders, and accountants |
| Main Components | Revenue, COGS, Operating Expenses, Taxes, and Net Income |
What Is a Profit and Loss Statement?
A profit and loss statement is a financial report that summarizes a company’s revenue, expenses, and final profit or loss during a specific accounting period. Businesses usually prepare this statement monthly, quarterly, or annually.
The main purpose of a P&L statement is to answer one simple question: did the business make money during this period?
If revenue is higher than expenses, the business earns a profit. If expenses are higher than revenue, the business reports a loss instead.
For example, if a company earns $100,000 in sales and spends $70,000 on expenses, it ends up with a profit of $30,000.
A profit and loss statement doesn’t only show the final profit number. It also explains how the business reached that result by showing income sources and expenses side by side.
A profit and loss statement is also known by several other names, including Income Statement, Statement of Operations, Statement of Revenue and Expenses, and Operating Statement. Although these names may sound different, they all refer to the exact same type of financial report.
Profit and Loss Statement Formula
Every profit and loss statement follows a basic calculation:
Revenue − Expenses = Net Profit (or Net Loss)
This formula shows the financial result of a business during a specific period.
Here’s a simple example:
| Description | Amount |
| Revenue | $80,000 |
| Expenses | $55,000 |
| Net Profit | $25,000 |
In this example, the business earned $80,000 and spent $55,000. After subtracting expenses, the company made a profit of $25,000. If expenses had been higher than revenue, the final result would have been a net loss instead.
This simple formula helps beginners understand the basic purpose of a profit and loss statement right from the start.
Why Is a Profit and Loss Statement Important?
A profit and loss statement does more than simply show whether a business made money. It helps businesses understand their financial performance and make better decisions overall.
- Measures Business Performance
- Helps Control Business Expenses
- Supports Better Business Decisions
- Helps Secure Loans and Investment
- Makes Financial Planning Easier
Who Uses a Profit and Loss Statement?
A profit and loss statement is useful for many people involved in a business.
Business Owners
Business owners use P&L statements to understand profitability, control costs, and measure business growth. It helps them answer important questions like whether the business is making money, whether expenses are increasing, and whether growth is actually improving profitability.
Managers and Accountants
Managers and accountants use P&L statements to monitor budgets, maintain accurate records, and analyze financial performance.
Investors
Investors review P&L statements to evaluate a company’s financial performance, looking at factors such as revenue growth, profit margins, and overall profitability before making investment decisions.
Lenders
Banks and lenders review profit and loss statements when considering business loans, since they want to know whether the business generates enough income to repay borrowed money.
What Does a Profit and Loss Statement Show?
A profit and loss statement shows how a business performs financially during a specific period. It explains where money comes from, where money goes, and how much profit remains after all expenses are paid.
A P&L statement usually includes Revenue, Cost of Goods Sold (COGS), Gross Profit, Operating Expenses, Operating Income, Other Income and Expenses, Income Taxes, and Net Income.
Each section provides different information about the business, and looking at all sections together helps owners understand whether the company is growing, controlling costs, and generating sustainable profits.
For example, a business may have high sales but still lose money because expenses are too high. Another business may have lower sales but stronger profits because it manages costs more efficiently.
This is why a profit and loss statement should never be viewed as only a profit calculation. It’s really a tool for understanding overall business performance.
Basic Structure of a Profit and Loss Statement
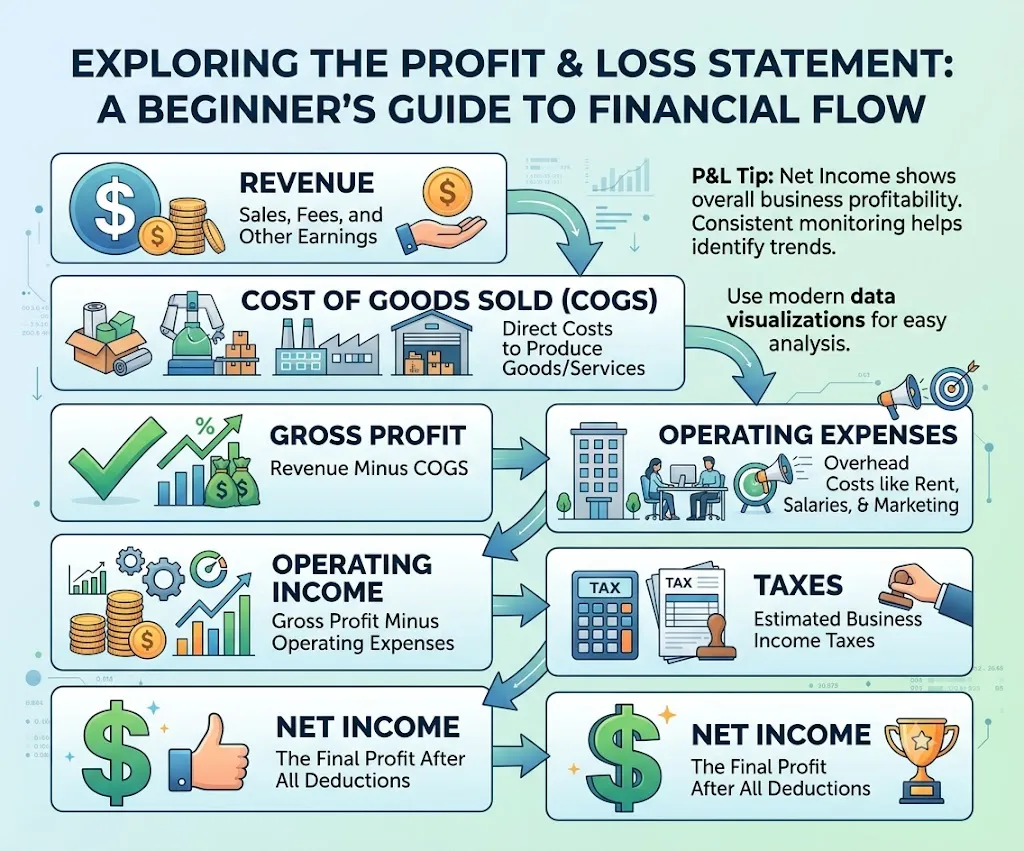
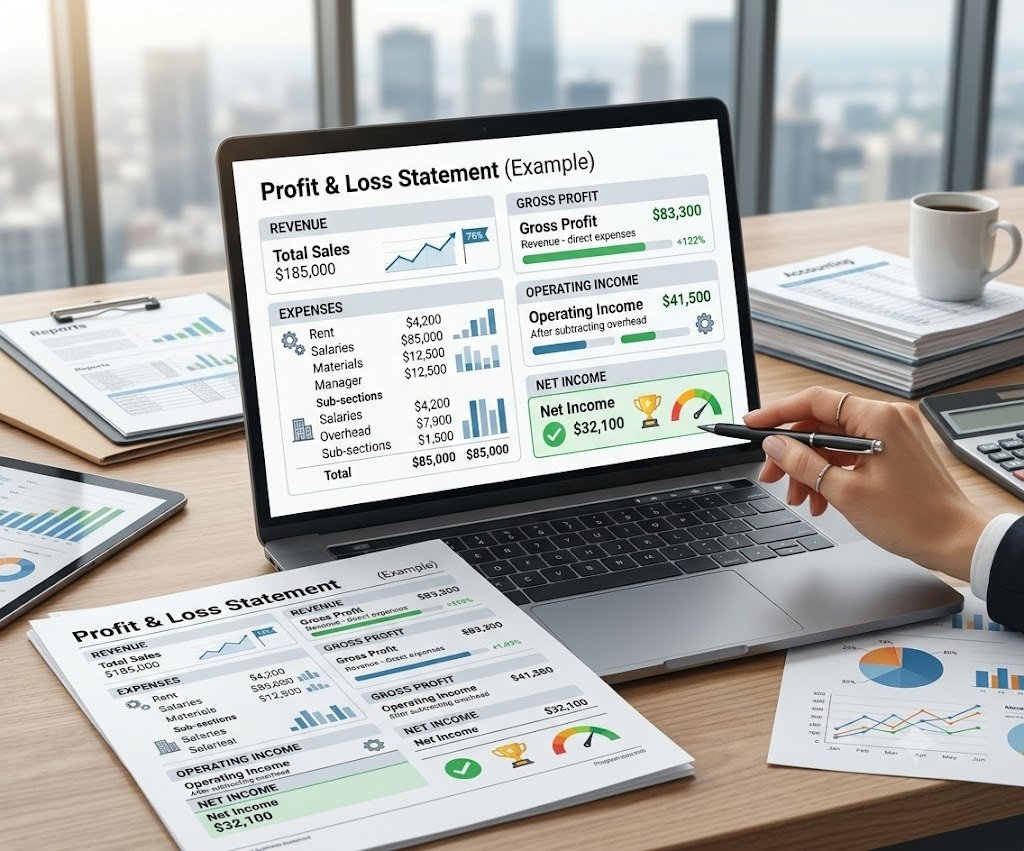
Most profit and loss statements follow a similar structure. The report starts with revenue and gradually subtracts different expenses until it reaches the final profit or loss.
| Section | Purpose |
| Revenue | Shows money earned from products or services |
| Cost of Goods Sold (COGS) | Shows direct costs related to producing goods or services |
| Gross Profit | Shows revenue remaining after direct costs |
| Operating Expenses | Shows daily costs of running the business |
| Operating Income | Shows profit from normal business operations |
| Other Income and Expenses | Shows non-operating financial activities |
| Income Taxes | Shows tax expenses |
| Net Income | Shows final profit or loss |
Understanding these sections makes it much easier to read and analyze any profit and loss statement you come across.
Revenue
Revenue is the total amount of money a business earns from selling products or providing services during a specific period. It’s usually the first section listed on a profit and loss statement because it represents the starting point for calculating profit.
Revenue may also be called sales, gross sales, income, or total revenue.
For example, if a clothing store sells 500 jackets for $100 each, its revenue would be 500 × $100, which equals $50,000.
However, revenue only shows how much money the business earned. It doesn’t show whether the business is profitable, since expenses still need to be deducted afterward.
Cost of Goods Sold (COGS)
Cost of Goods Sold, commonly called COGS, represents the direct costs required to create a product or deliver a service. These costs are directly connected to the items a business actually sells.
Common examples include raw materials, inventory costs, manufacturing labor, product packaging, and production supplies.
Revenue − Cost of Goods Sold = Gross Profit
COGS doesn’t include general business costs such as office rent, marketing expenses, administrative salaries, or software subscriptions. Those costs get recorded under operating expenses instead.
Gross Profit
Gross profit shows how much money remains after subtracting the direct costs of producing goods or services.
The formula is: Gross Profit = Revenue − Cost of Goods Sold
For example:
| Description | Amount |
| Revenue | $120,000 |
| Cost of Goods Sold | $70,000 |
| Gross Profit | $50,000 |
Gross profit helps businesses understand how efficiently they produce and sell their products. A higher gross profit may indicate better pricing strategies, lower production costs, efficient operations, or strong inventory management.
Operating Expenses
Operating expenses are the everyday costs required to run a business. Unlike COGS, operating expenses aren’t directly related to creating products or delivering services. Instead, they support the overall operation of the company.
Common operating expenses include employee salaries, office rent, utilities, insurance, marketing costs, software subscriptions, office supplies, internet and phone bills, travel expenses, depreciation, administrative expenses, and general and administrative (G&A) expenses
Some businesses also record depreciation and amortization expenses. Depreciation represents the gradual reduction in value of physical assets such as equipment and buildings, while amortization applies to certain intangible assets such as software or intellectual property.
Operating Income
Businesses may also review EBITDA (earnings before interest, taxes, depreciation, and amortization) as another measure of operating performance. EBITDA helps analysts evaluate profitability before certain non-operating and non-cash expenses are considered.
The formula is: Operating Income = Gross Profit − Operating Expenses
Example:
| Description | Amount |
| Gross Profit | $80,000 |
| Operating Expenses | $45,000 |
| Operating Income | $35,000 |
Operating income is useful because it shows whether the core business model is genuinely profitable. A company may have strong revenue, but if operating expenses run too high, operating income will still decrease.
Other Income and Expenses
Not every financial activity comes from the company’s main operations. Some businesses earn additional income or experience expenses that are unrelated to their primary activities, and these get recorded separately as other income and expenses.
Examples of Other Income: interest income, investment gains, dividend income, and the sale of business assets.
Examples of Other Expenses: loan interest payments, investment losses, foreign exchange losses, and legal settlements.
Separating these items helps readers understand whether profits are coming from normal business operations or from unusual, one-off events.
For example, a company may report a higher profit because it sold a building. While this increases income, it doesn’t necessarily mean the company’s regular business actually improved.
Income Taxes
Income taxes represent the amount a business owes to government authorities based on taxable income. The way taxes appear on a profit and loss statement depends heavily on the business structure.
Corporations usually report income tax expenses directly on the income statement, while sole proprietorships and some partnerships may handle taxes differently, since owners often report business income on their personal tax returns instead.
Regardless of the structure, taxes still reduce the final amount of profit available to the business.
Net Income
Net income is the final result shown on a profit and loss statement, representing the amount left after subtracting all expenses from total revenue.
The formula is: Net Income = Total Revenue − Total Expenses
Expenses may include Cost of Goods Sold, operating expenses, interest expenses, other expenses, and taxes.
How the Profit and Loss Statement Works Together
Each section of the profit and loss statement connects directly with the next one. The calculation follows this order:
Revenue → Cost of Goods Sold → Gross Profit → Operating Expenses → Operating Income → Other Income and Expenses → Income Taxes → Net Income
This structure helps business owners identify exactly where financial problems or improvements are actually happening.
How to Prepare a Profit and Loss Statement
Creating a profit and loss statement becomes much easier once you understand the basic sections. The process involves collecting financial information, organizing revenue and expenses, and calculating the final profit or loss.
Most businesses follow the same preparation process, whether they’re small businesses, startups, or larger companies.
Follow these steps to prepare a profit and loss statement.
Step 1: Choose the Reporting Period
The first step is deciding the period you want the profit and loss statement to cover. Common reporting periods include monthly, quarterly, and annually.
Monthly reports help businesses track performance regularly and identify problems quickly. Quarterly reports are often used by larger businesses to review financial progress. Annual reports provide a complete view of business performance during the fiscal year.
Choosing the right reporting period really depends on how frequently you need financial information.
Step 2: Calculate Total Revenue
The next step is calculating all income earned during the reporting period. Revenue may include product sales, service income, subscription payments, consulting fees, rental income, and commission income.
For example, imagine a coffee shop earns money from different sources:
| Revenue Source | Amount |
| Coffee Sales | $18,000 |
| Pastries | $5,500 |
| Merchandise | $1,500 |
| Total Revenue | $25,000 |
The total revenue becomes the first number recorded on the profit and loss statement.
Step 3: Calculate Cost of Goods Sold (COGS)
After calculating revenue, the next step is identifying the direct costs involved in producing products or delivering services. These costs may include raw materials, inventory, manufacturing labor, packaging, and shipping supplies.
Add all income sources during the reporting period to calculate total revenue.
Step 4: Calculate Gross Profit
Once revenue and COGS are known, calculate gross profit using the formula: Gross Profit = Revenue − Cost of Goods Sold
Example:
| Description | Amount |
| Total Revenue | $25,000 |
| Cost of Goods Sold | $7,000 |
| Gross Profit | $18,000 |
Gross profit shows how much money remains after covering the direct costs of products or services. A strong gross profit usually means the business has good pricing, controlled production costs, or efficient operations.
Step 5: Add Operating Expenses
The next step is listing the costs required to operate the business. These expenses aren’t directly related to producing products; instead, they support daily business activities.
Common operating expenses include employee salaries, rent, utilities, marketing, insurance, software subscriptions, office supplies, and equipment maintenance.
Fixed Expenses vs. Variable Expenses
Operating expenses can be divided into two main categories: fixed expenses and variable expenses.
Fixed expenses stay relatively stable regardless of sales activity. Examples include office rent, insurance, employee salaries, and property taxes. A business usually pays these costs even when sales are low.
Variable expenses change depending on business activity. Examples include packaging costs, shipping costs, sales commissions, credit card processing fees, and production supplies.
Understanding the difference between fixed and variable expenses helps businesses plan budgets and manage costs more effectively.
Step 6: Calculate Operating Income
After calculating gross profit and operating expenses, determine operating income using the formula: Operating Income = Gross Profit − Operating Expenses
Operating income shows how profitable the company’s normal business activities are before considering interest and taxes.
Step 7: Record Other Income and Expenses
Some financial activities don’t come from normal business operations, and these items should be recorded separately.
Step 8: Deduct Income Taxes
After calculating income before taxes, subtract applicable tax expenses. The amount depends on business structure, location, tax regulations, and taxable income.
After deducting taxes, the business reaches its final profit figure.
Step 9: Calculate Net Income
The final step is calculating net income, which represents the actual profit remaining after all expenses have been deducted.
The coffee shop earned $5,900 after paying all of its business expenses.

How to Read and Analyze a Profit and Loss Statement
Preparing a profit and loss statement is only the first step. The real value comes from understanding what the numbers actually mean.
A P&L statement helps you identify whether revenue is growing, whether expenses are increasing, whether profits are improving, where money is being spent, and which areas need attention.
Here’s how to analyze each section in more detail.
Review Revenue Growth
Revenue is the first area to examine because it shows how much money the business earns.
Ask whether revenue is increasing or decreasing, how this period compares with previous periods, which products or services generate the most income, and whether seasonal changes are affecting sales.
Increasing revenue is usually positive, but higher sales don’t always mean higher profits. A business can increase sales while losing money if expenses rise faster than revenue.
Analyze Cost of Goods Sold (COGS)
COGS shows how much a business spends to create products or provide services.
When reviewing COGS, consider whether production costs are increasing, whether supplier prices have changed, whether inventory costs are under control, and whether materials are being used efficiently.
If COGS increases faster than revenue, gross profit may decrease. For example, a restaurant may increase sales but still earn less profit if food costs rise significantly.
Evaluate Gross Profit
Gross profit helps measure how efficiently a business creates and sells its products. A healthy gross profit often indicates effective pricing, controlled production costs, and strong operational efficiency.
If gross profit declines over time, businesses may need to review pricing strategies, supplier costs, production methods, and inventory management.
Review Operating Expenses
Operating expenses are another important area to analyze. Look for unnecessary spending, increasing overhead costs, expenses that grow faster than revenue, and departments exceeding their budgets.
Small cost reductions can have a significant impact on profitability. For example, reducing unnecessary software subscriptions or lowering marketing waste can improve profit without increasing sales.
Evaluate Operating Income
Operating income shows how profitable the main business operations are. A strong operating income usually means the business controls expenses well, products are priced correctly, and operations run efficiently.
If operating income decreases while revenue remains stable, rising expenses may be the underlying cause.
Analyze Net Income
Net income shows the final profitability of the business. A positive net income means revenue exceeds total expenses, while a negative net income means expenses are higher than revenue.
However, net income should always be reviewed alongside other sections. A company may have a temporary loss because of expansion costs, new investments, or one-time expenses.
Compare Results Over Time
A single profit and loss statement provides useful information, but comparing multiple periods gives much deeper insights.
Businesses often compare month-over-month results, quarter-over-quarter results, and year-over-year results. Trend analysis helps answer important questions like whether revenue is growing consistently, whether expenses are increasing too quickly, whether profit margins are improving, and whether the business is becoming more efficient.
Reviewing trends helps businesses make better long-term decisions overall.
Key Financial Ratios You Can Calculate From a Profit and Loss Statement
A profit and loss statement provides more than just revenue and profit numbers. It also helps businesses calculate several important financial ratios.
These ratios make it easier to measure profitability, compare performance over time, and understand how efficiently a business operates.
Gross Profit Margin
Gross profit margin shows how much revenue remains after covering the direct costs of producing goods or services.
The formula is: Gross Profit Margin = (Gross Profit ÷ Revenue) × 100
Operating Profit Margin
Operating profit margin measures how much profit remains after covering operating expenses.
The formula is: Operating Profit Margin = (Operating Income ÷ Revenue) × 100
This ratio helps businesses understand how efficiently they manage their normal operations.
Net Profit Margin
Net profit margin shows how much profit remains after all expenses have been paid.
The formula is: Net Profit Margin = (Net Income ÷ Revenue) × 100
A higher net profit margin generally indicates stronger overall profitability.
Profit and Loss Statement vs. Balance Sheet
Many beginners confuse a profit and loss statement with a balance sheet. Although both are important financial reports, they provide genuinely different information.
| Profit and Loss Statement | Balance Sheet |
| Shows financial performance over a period | Shows financial position at a specific date |
| Reports revenue and expenses | Reports assets, liabilities, and equity |
| Measures profit or loss | Shows what the business owns and owes |
| Covers monthly, quarterly, or annual activity | Represents one point in time |
A simple way to remember the difference: a profit and loss statement explains how the business performed, while a balance sheet explains what the business owns and owes. Both reports work together to provide a complete view of financial health.
Profit and Loss Statement vs. Cash Flow Statement
Another common misunderstanding is the difference between profit and cash flow. A business can be profitable but still experience genuine cash problems.
| Profit and Loss Statement | Cash Flow Statement |
| Records revenue and expenses | Tracks actual cash received and paid |
| Measures profitability | Measures cash movement |
| Includes non-cash expenses like depreciation | Focuses on cash transactions |
| Shows whether the business made a profit | Shows whether the business has enough cash available |
For example, a company may record a sale as revenue before receiving payment from a customer. The profit appears on the P&L statement, but the cash hasn’t actually entered the business yet. This is exactly why businesses often review both reports together.
How to Identify a Healthy or Unhealthy Profit and Loss Statement
A healthy profit and loss statement doesn’t look exactly the same for every business. However, many successful businesses share similar financial patterns.
Positive Signs
- Growing revenue
- Stable margins
- Controlled expenses
- Increasing profit
Warning Signs
- Falling revenue
- Rising costs
- Declining margins
- Negative profits
Types of Profit and Loss Statements
Businesses may use different formats depending on their size, industry, and reporting needs. The two main types are the single-step profit and loss statement and the multi-step profit and loss statement.
Single-Step Profit and Loss Statement
A single-step profit and loss statement is the simplest format available. It combines all revenue into one section and all expenses into another section.
The formula is: Total Revenue − Total Expenses = Net Income
Example:
| Description | Amount |
| Total Revenue | $80,000 |
| Total Expenses | ($60,000) |
| Net Income | $20,000 |
Advantages of a Single-Step Statement: easy to prepare, easy to understand, requires less accounting detail, and useful for small businesses.
Disadvantages of a Single-Step Statement: provides limited analysis, doesn’t show gross profit, and doesn’t separate operating from non-operating activities.
Multi-Step Profit and Loss Statement
A multi-step profit and loss statement provides much more detailed information. Instead of calculating profit in one step, it separates different stages of profitability.
A multi-step statement usually includes Revenue, Cost of Goods Sold, Gross Profit, Operating Expenses, Operating Income, Other Income and Expenses, Taxes, and Net Income.
Example:
| Description | Amount |
| Revenue | $150,000 |
| Cost of Goods Sold | ($80,000) |
| Gross Profit | $70,000 |
| Operating Expenses | ($40,000) |
| Operating Income | $30,000 |
| Other Expenses | ($3,000) |
| Taxes | ($7,000) |
| Net Income | $20,000 |
This format gives businesses much more detailed insight into their financial performance.
Single-Step vs. Multi-Step Profit and Loss Statement
| Feature | Single-Step | Multi-Step |
| Easy to prepare | Yes | No |
| Shows Gross Profit | No | Yes |
| Shows Operating Income | No | Yes |
| Suitable for small businesses | Yes | Yes |
| Provides detailed analysis | Limited | Strong |
Small businesses often start with a single-step format and move toward multi-step reporting as they grow.
How Small Businesses Use a Profit and Loss Statement
A profit and loss statement isn’t only useful for accountants. Small business owners use it as a daily financial management tool.
Track Business Growth
Comparing P&L statements over time helps business owners understand whether sales and profits are increasing. For example, comparing monthly reports can show revenue growth, expense changes, seasonal patterns, and profit trends.
Control Expenses
A P&L statement shows exactly where money is being spent. Business owners can identify unnecessary subscriptions, high operating costs, and overspending in specific areas, and reducing these unnecessary expenses can improve profitability.
Set Better Prices
Businesses often review their profit and loss statements before changing prices. If production costs increase, adjusting prices may help maintain healthy profit margins.
Prepare for Taxes
A properly maintained P&L statement makes tax preparation much easier. Instead of searching through receipts and invoices, businesses already have an organized record of income and expenses ready to go.
Apply for Business Loans
Banks and lenders often request financial statements before approving business loans. A profit and loss statement helps them evaluate business profitability, ability to repay debt, and overall financial stability.
Attract Investors
Investors use financial reports to understand whether a business has real growth potential. A strong P&L statement can demonstrate consistent revenue, healthy profit margins, and good expense management.
Best Practices for Maintaining a Profit and Loss Statement
Preparing a P&L statement is important, but keeping it accurate over time is even more valuable.
Update It Regularly
Don’t wait until the end of the year. Reviewing your profit and loss statement monthly helps you identify problems earlier rather than later.
Record Every Transaction
Small expenses can add up over time, so it’s worth recording business purchases, sales income, fees, subscriptions, and other expenses as they happen. Accurate records create more reliable financial reports.
Keep Business and Personal Expenses Separate
Mixing personal and business expenses can make financial reports inaccurate. Using separate accounts makes bookkeeping easier and improves reporting accuracy considerably.
Review Trends Instead of Single Numbers
One month of profit doesn’t always show the complete picture. Compare multiple periods to understand long-term performance more clearly.
Use Accounting Software
Accounting software can automatically organize transactions and generate financial reports. It reduces manual work and lowers the chance of calculation errors along the way.
Frequently Asked Questions
Is a Profit and Loss Statement the Same as an Income Statement?
Yes. A profit and loss statement and an income statement are different names for the same financial report. Both show revenue, expenses, and net income over a specific period.
How Often Should a Profit and Loss Statement Be Prepared?
Most businesses prepare profit and loss statements monthly, quarterly, or annually. Monthly reports are useful for monitoring performance, while annual reports help with long-term planning and tax preparation.
Who Uses a Profit and Loss Statement?
A P&L statement is used by business owners, managers, investors, lenders, and accountants. Anyone who wants to understand business profitability can benefit from reviewing one.
Can I Use a Profit and Loss Statement Template?
Yes. Many small businesses use profit and loss statement templates in Excel, Google Sheets, or accounting software to organize revenue, expenses, and profit calculations. Templates can help beginners create consistent financial reports while reducing manual errors.
Can I Create My Own Profit and Loss Statement?
Yes. Small businesses can create P&L statements using Excel, Google Sheets, or accounting software. You don’t need advanced accounting knowledge if your income and expenses are recorded accurately.
What Is Not Included in a Profit and Loss Statement?
A profit and loss statement doesn’t include assets, liabilities, owner’s equity, or cash balance. These items appear in other financial statements instead, such as the balance sheet and cash flow statement.
What Is the Difference Between Gross Profit and Net Profit?
Gross profit is the money left after subtracting COGS from revenue. Net profit is the final amount remaining after subtracting all expenses, including operating costs, interest, and taxes.
Conclusion
A profit and loss statement is more than just a report showing profit or loss. It is a practical tool that helps businesses understand what is working, what needs improvement, and where financial decisions should be adjusted.
From analyzing business performance to controlling expenses and planning future growth, a clear understanding of your P&L can significantly improve the way you manage a company.
In my experience studying business finances, the biggest advantage comes from reviewing these numbers consistently rather than only looking at them when problems appear. Businesses that understand their revenue, costs, and profitability have a much stronger foundation for making confident decisions.
Whether you run a small business, manage a startup, or are learning accounting basics, knowing how to read a profit and loss statement is an essential financial skill.